🔥 On Perception, Representation, and What Gets Lost in the Chart
A heatwave, jazz, theatre, photography, and cinema. A week in Berlin read through the lens of cognitive science and data visualisation research.
Berlin does not behave like a dataset that wants to be cleaned. It behaves more like a system that resists simplification while still demanding interpretation.
This week I moved through it slowly, and so did everyone else. A heatwave arrived mid-week and stayed. By the weekend, the German Weather Service had issued its highest-level heat warning, temperatures were grazing 41 °C, and the nights refused to cool below the mid-twenties. Berlin in late June is not supposed to feel like this; the city has no institutional memory for it, and it showed. Parks emptied by midday. Streets reorganised themselves around shade.
Jazz improvisations that refused linearity. Theatre that questioned its own framing. A photography exhibition that revealed how meaning depends on selection rather than capture. Cinema that shifted emotional variables instead of defining them. Each venue is above sixty percent capacity, but because of the heat. Air conditioning is still rare enough in this city that wherever it existed, people gathered, and the cultural programme absorbed the overflow.
At some point, the experiences stopped being separate cultural events.
They became a study in perception and perception is never neutral. It is structured, limited, and culturally shaped and that week, it was also thermally mediated, one could sit still long enough to think. Scaife and Rogers (1996) argue that cognition is not confined to the mind alone but is distributed across external representations, where diagrams, images, and artefacts actively shape thinking rather than simply display it.
That idea stayed with me longer than any single performance. Because in both analytics and art, meaning does not pre-exist the representation. It is constructed through it.
Berlin heatwave June 22-28 2026: daily temperature, feels-like temperature, humidity, and air quality index
Peak temperature
40 °C
Sun 28 Jun
Peak feels-like
43 °C
Sun 28 Jun
Min. humidity
26 %
During peak heat
Air quality (AQI)
55
Moderate · ozone-led
Humidity scale right axis. Nighttime lows stayed 25-28 °C, giving no overnight relief.
AQI (US scale). Moderate = 51-100. Ozone rises sharply when temperatures exceed 35 °C and air is stagnant.
External Representation Is Not Passive
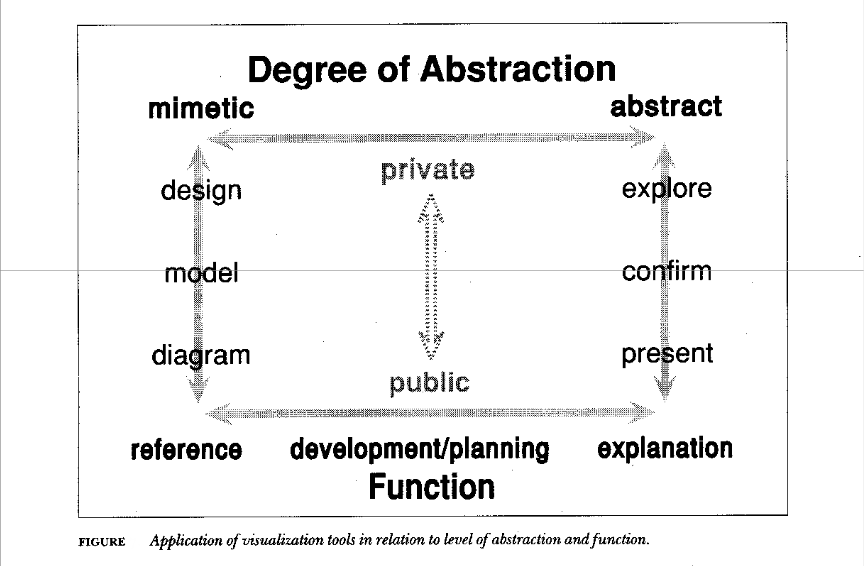
Scaife and Rogers (1996) propose a foundational idea in cognitive science; external representations are not passive carriers of information, but active participants in cognition itself. They shape how information is interpreted, structured, and remembered. In other words, thinking does not happen first and visualization later.
Thinking happens through visualization. This becomes visible when moving through artistic environments.
A jazz performance does not present a fixed structure, it externalizes cognition in real time. A theatre stage does not represent meaning but distributes it across bodies, timing, silence, and tension.
Berlin this week felt like moving inside a collection of external cognitive systems. Each one asks the same question differently: What happens when meaning is not stored, but performed?
Visual Encoding Is Always a Choice, Never Neutral
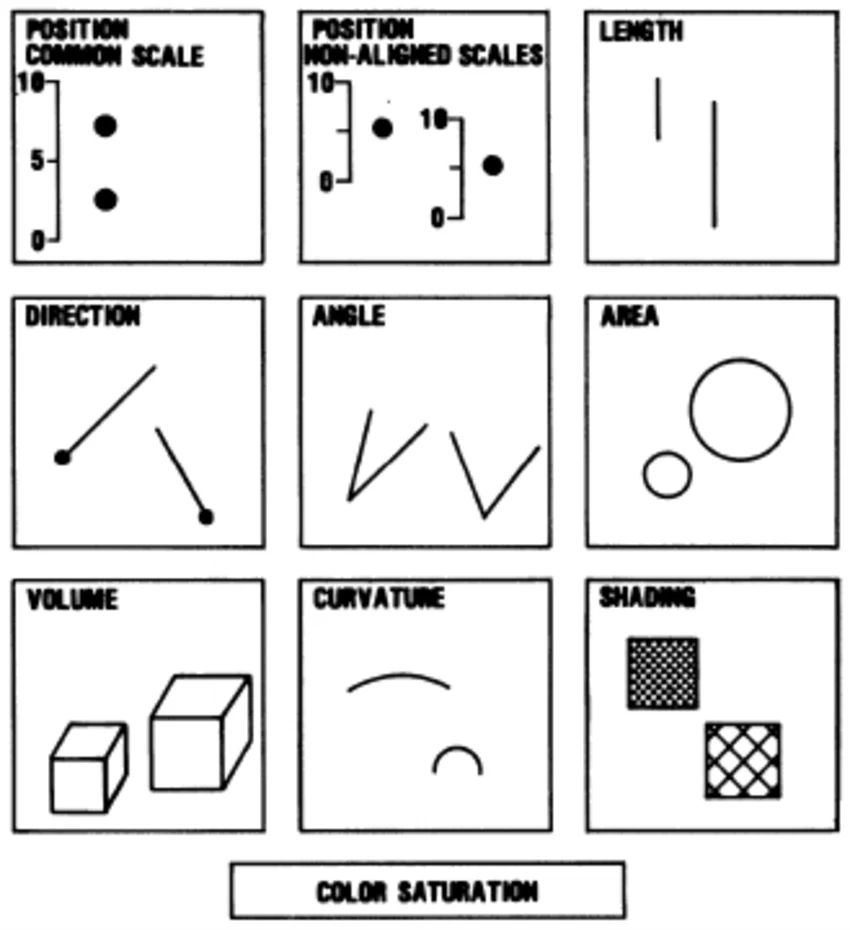
Cleveland and McGill (1984) showed that visual encodings differ in perceptual accuracy. Position is interpreted more accurately than length, length more accurately than angle, and so on. This hierarchy is not aesthetic. It is cognitive constraint. Different visual forms do not only communicate different values. They communicate different degrees of confidence, ambiguity, and interpretability.
In Berlin, this hierarchy was not theoretical; in other words, experiential.
A photograph in C/O Berlin did not only show an image. It framed uncertainty. A theatre performance did not resolve meaning. It intentionally distributed ambiguity. A film did not clarify emotion. It layered it. It is a feature of interpretation. And in lived experience, uncertainty is often where meaning becomes most active.
Perception Becomes Stronger When It Is Distributed
Heer and Bostock (2010) demonstrate that aggregated judgments across multiple observers can improve perceptual accuracy in visualization tasks. Individual perception is variable, but collective interpretation stabilizes meaning. This idea extends beyond data systems. It applies to culture itself.
One viewer sees composition. Many viewers produce pattern recognition across interpretation. As well as one analyst sees a dashboard. Many stakeholders create shared meaning through discussion, disagreement, and alignment.
Perception is not isolated. It is socially reinforced.
Cognitive Systems Outside the Screen
MacEachren (1990) describes cartographic visualization as a process of pattern discovery rather than simple representation. Maps, in this framing, are tools for reasoning rather than passive depictions of spatial data. This idea extends beyond geography.
It suggests that any structured visual or performative system can function as a cognitive environment.
Jazz becomes a system for testing non-linearity. Theatre becomes a system for exploring framing effects. Photography becomes a system for examining selection bias. Cinema becomes a system for manipulating temporal perception.
None of these are “data visualizations” in the technical sense. But all of them externalize cognition. …and once cognition is externalized, it becomes observable.
What This Means for Analytical Practice
The assumption in most analytical environments is that better models produce better understanding, but the research suggests something more fundamental. Understanding begins with perception, not computation.
Cleveland and McGill (1984) show that perception is structured. Scaife and Rogers (1996) state that cognition is distributed. According to MacEachren et al. (1990), uncertainty is encoded, not removed. Heer and Bostock (2010) also show that meaning stabilizes through aggregation.
Together, they describe something important; analytical truth is not only calculated. It is constructed through systems of representation, interpretation, and shared cognition.
This week did not produce conclusions, but it changed the way ambiguity feels. As well as in analytical work, that shift is often more important than resolution, because not all uncertainty should be removed. Some of them should be understood.
References
- Cleveland, W.S. and McGill, R. (1984) ‘Graphical perception: Theory, experimentation, and application to the development of graphical methods’, Journal of the American Statistical Association, 79(387), pp. 531–554.
- Heer, J. and Bostock, M. (2010) ‘Crowdsourcing graphical perception: Using Mechanical Turk to assess visualization design’, Proceedings of the SIGCHI Conference on Human Factors in Computing Systems, pp. 203–212.
- MacEachren, A.M. (1990) ‘A pattern identification approach to cartographic visualization’, Cartographica, 27(2), pp. 64–81.
- Scaife, M. and Rogers, Y. (1996) ‘External cognition: how do graphical representations work?’, International Journal of Human-Computer Studies, 45(2), pp. 185–213.